
A graphics program generates graphical output rather than text output. Conceptually, text output can be thought of as output to a device that consists of a rectangular array of characters used to display lines of text. Graphical output can be thought of as output to a device that consists of a rectangular array of pixels (picture elements) each of which can be set to a specific color. Graphical output can consist of drawings and/or images. Of course, graphical output can also include text where each character is basically a small image.
The graphics package we will be using is called "WinBGIm" which requires a little explanation. Borland was a company that wrote Pascal and C/C++ compilers for DOS-based machines. They developed a graphics package that they named Borland Graphics Interface (BGI). Following the popular adoption of the Microsoft Windows operating system, this package was adapted to run on windows-based machines (winBGI). Finally, the "m" indicates that the package was modified to include mouse support.
In this course, the graphics device is a window that is created and displayed by our application. This window represents a two-dimensional array of pixels. The width of the window is the number of pixels per row (side to side) and the height of the window is the number of pixels per column (top to bottom). Each pixel is specified by its row and column position where coordinates (0, 0) corresponds to the pixel in the upper-left corner of the window and (width-1, height-1) corresponds to the pixel in the lower-right corner of the window.
In the image below, the graphics window (the inner black portion) is 200 pixels wide and 150 pixels high. The coordinates of the four corners are shown:
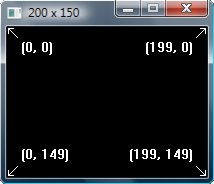
As with the normal Cartesian coordinate system, x represents the horizontal distance from the origin and y represents the vertical distance. Unlike the Cartesian system, y increases as you go down (rather than as you go up).
Let's build a very simple graphics project using Quincy.
1. Run Quincy and click the "New" tool button (or select the "New" option on the file menu).
2. In the New dialog, choose "Project" and click the OK button.
3. In the Project Properties window
4. After Quincy displays your project window, click the "Save" tool button to save your project. Make sure you save your project in the folder you specified as the target path.
5. Click the "New" tool button again.
6. In the New dialog, choose "C++ Source File" and click the OK button.
7. Click the "Save" tool button and save your source file as "HelloWorld.cpp". (The source file doesn't haven't to have the same name as the project, but it is as good a name as any.)
8. On Quincy's "Project" menu, select the "Insert file(s)" option and add the HelloWorld.cpp file to your project. This completes the setup of the project.
9. Enter the following code in your HelloWorld.cpp file:
//-----------------------------------------------
// HelloWorld
//
// A very simple graphics program.
//-----------------------------------------------
#include <graphics.h>
#include <iostream>
using namespace std;

int main()
{
    int grErrCode;

    // Initialize the graphics window.

    initwindow(200, 200, "Hello World");
    grErrCode = graphresult();
    if( grErrCode != grOk )
    {
        cout << " Graphics System Error: " << grapherrormsg(grErrCode) << endl;
        exit( 1 );
    }

    // Draw a white square in the center of the screen.

    setcolor(WHITE);
    line( 50,  50, 150,  50);  // top
    line(150,  50, 150, 150);  // right side
    line(150, 150,  50, 150);  // bottom
    line( 50, 150,  50,  50);  // left side


    // Fill the interior of the square with light blue.

    setfillstyle(SOLID_FILL, LIGHTBLUE);
    floodfill(100, 100, WHITE);

    // Display the text "Hello World" in the middle of the square in black.

    setcolor(BLACK);
    setbkcolor(LIGHTBLUE);
    bgiout << "Hello World";
    outstreamxy(61, 92);

    // Terminate the program after user taps almost any key.

    getch();
    closegraph();

    return 0;
}
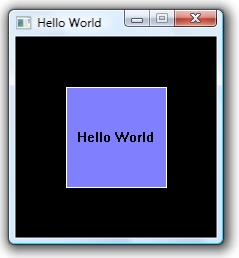
10. Compile and run your Hello World application. The application will open two windows: a normal console (text-based) window (named "Quincy 2005) and a graphics window (named "Hello World"). The graphics window should look something like this:
11. To terminate the program, first make sure that the graphics window is the active window. Then either tap a key or click the close button on the graphics window. This will close the graphics window but the console window will still be open with the usual "Press Enter to return to Quincy..." message. Press Enter to close the console window.
A graphics program must include the "graphics.h" header file.
All you need to do to create a graphics window is invoke the initWindow function:
void initwindow(int width, int height, string title);
The first argument is the width of the window (in pixels), the second argument is the height of the window (in pixels), and the third argument is the window title (which is displayed at the top of the window). The width and height are the dimensions of the interior of the window and does not include the surrounding border.
The code immediately following the initwindow invocation makes sure no errors occurred in opening the window. Like memory allocation, the window initialization will seldom fail. Nevertheless, it is a good idea to check just in case.
Before actually drawing the rectangle, the drawing color is set to WHITE. There are 16 named colors: BLACK, BLUE, GREEN, CYAN, RED, MAGENTA, BROWN, LIGHTGRAY, DARKGRAY, LIGHTBLUE, LIGHTGREEN, LIGHTCYAN, LIGHTRED, LIGHTMAGENTA, YELLOW, WHITE. These are integer constants defined in the graphics.h header file. The corresponding integer values range from 0 to 15 respectively.
The four vertices of the rectangle are (50, 50), (50, 150), (150, 150), and (50, 150). The line function has the following prototype:
void line(int x1, int y1, int x2, int y2)
The first two parameters (x1, y1) are the coordinates of the first endpoint and the last two parameters (x2, y2) are the coordinates of the second endpoint. The line function draws a line between the two endpoints. The logic to draw the rectangle is very simple:
We wanted the interior of the rectangle to be light blue rather than black. This requires a flood fill operation:
floodfill(int x, int y, int borderColor)
The first two parameters represent a point. Think of the border color as a wall. You take a can of paint and pour it on the point (x, y). The paint flows out in all directions until it hits the wall. That is, the paint floods the region containing the specified point up to but not including the specified border color. There must be an unbroken border surrounding the specified point because otherwise the paint will flow through any gaps and flood the area outside the region as well.
Before invoking the floodfill function, you must set the fill style (i.e., the fill pattern and the fill color):
void setfillstyle(int pattern, int color)
There are 12 named fill patterns (corresponding to the integers 0 to 11). The SOLID_FILL pattern indicates a solid color. The color parameter indicates the color to be used in the flood fill operation.
In C++, the standard output stream, cout, represents a stream of characters whose source is the application program and whose destination is the computer screen. The insertion operator is used to insert text into the cout stream. In the graphics package, bgiout represents a stream of characters whose source is the application program and whose destination is a string object. The insertion operator is used to insert text into the bgiout stream. The insertion operator is used exactly the same way in both cases. The only difference is in the stream that is being manipulated.
Since the destination of the bgiout stream is a string object, inserting something into the stream simply appends it to the end of the string object. To display the string object on the graphics window requires the invocation of a second function:
void outstreamxy(int x, int y)
This function takes the contents of the string object (the destination of the bgiout stream) and displays it on the graphics window at the specified location. After being displayed, the value of the string object is reset to the empty string.
To use an analogy, inserting something into the bgiout stream is like placing it at the end of a vacuum cleaner hose. It is sucked up and deposited in the vacuum cleaner bag (representing the string object). You can't see what is in the vacuum cleaner bag until you empty its contents onto the table. In effect, the outstreamxy function empties the contents of the vacuum cleaner bag (the string object) onto the graphics window (the table).
Each character is implemented as a bitmap (a small picture). The width of the bitmap depends on the character but all of the bitmaps are 16 pixels high. In the examples below, the white pixels would be replaced by the current background color and the black pixels would be replaced by the current drawing color:
| H | e | ell | space |
 |
 |
|
|
| 10 x 16 | 8 x 16 | 4 x 16 | 4 x16 |
The location specified in the outstreamxy function represents the location of the upper-left pixel of the bitmap of the first letter of the text. In our sample program, (61, 92) is the location of the upper-left pixel of the letter 'H' in the text "Hello World":
What I have said above applies to the default font. Different fonts may have bitmaps of different heights.
When you run a graphics program, you usually don't want the program to terminate until the user has had a chance to see the graphics window. Consequently, we have to pause the execution of the program until the user is ready to close it. In other words, the program must wait for some user input before it terminates. That is why we have always seen the "Press Enter to return to Quincy" message on the console window after our text-based programs are done. Quincy is giving us an opportunity to view the results before closing the window.
Input using the standard input stream (cin) is buffered. That is, no characters are actually inserted into the stream until we tap the Enter key. Consequently, we have to tap the Enter key to terminate a Quincy console application.
C++ also provides functions for unbuffered input. That is, there are functions that allow us to grab characters that are typed at the keyboard immediately after they are typed (without waiting for the user to tap the Enter key). The getch function does just that. The function name is short for "get character" and it reads each character as it is typed. This function returns the next character typed at the keyboard. Most of the time, the return value would be assigned to a character variable which would then be processed:
char ch;
ch = getch();
// process ch
In our graphics application, however, we don't need to do anything with the character the user types in. In this context, we invoke the getch function as though it were void function (as though it did not return a value). In effect, the invocation of the getch function causes the program to halt execution until the user types a character (any character) on the keyboard. When the user does tap a key, the resulting character is thrown away (because we didn't really need it) and the program continues execution by closing the graphics window and terminating. As always, when our program has terminated we see the "Press Enter to return to Quincy" message in the console window.
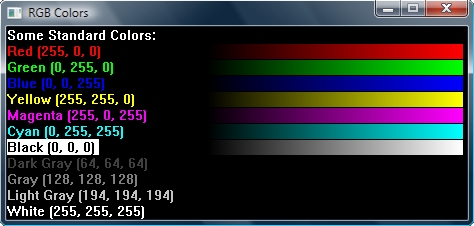
As noted earlier, there are 16 named colors. In Windows, however, we can choose from among 16,777,216 different colors. Each of these colors is a combination of just three different colors: red, green, and blue (hence, RGB). More specifically, each color is determined by the intensity of its red component, its green component, and its blue component. The intensity of each component is an integer in the range 0 to 255 where 0 represents the absence of that component and 255 represents the maximum possible intensity.
The graphics package includes a function that allows you to specify any of these millions of colors:
int COLOR(int red, int green, int blue)
where each parameter indicates the intensity (0 to 255) of the corresponding color. In the illustration below, some of the standard colors are displayed with the corresponding RGB intensities. The color bands represent different shades of the corresponding basic color. For example, magenta is a combination of red and blue with no green. Different shades of magenta have the same intensity of red and blue but no green: (1, 0, 1), (2, 0, 2), (3, 0, 3), ..., (255, 0, 255). Notice that if the red, green, and blue intensities are all the same, you get shades of gray ranging from black to white.
Don't ask me why the authors of our graphics package used only upper-case letters in the name of this function because I don't know.
In this section we will look at three other approaches to drawing our square.
Here is another algorithm for drawing our square:
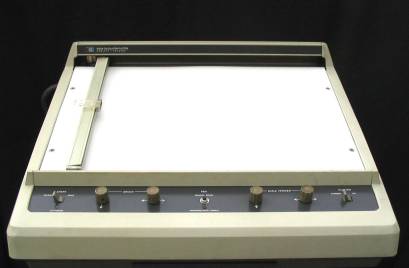
The first graphics devices were pen plotters; machines that drew graphics on paper using a pen. The pen was driven by two stepping motors that moved the pen in small discrete increments. One motor moved the pen horizontally across the page and the other motor moved the pen vertically. The horizontal and vertical position of the pen represented a point on the paper. The origin of this coordinate system was at the upper-left corner of the paper. Sound familiar? In the image below, the vertical bar moved left to right across the page and the pen holder (seen near the middle of the bar) moved up and down. This is an HP plotter from 1968. It was featured in the opening scenes of the science fiction movie, "The Andromeda Strain" where it supposedly draws an arrow on a map. If you watch carefully, however, the arrow is already drawn on the map. The tapping of the pen at the tip of the arrow is an example of dramatic license.
On a plotter, the pen could be moved from its current point to a new point by lifting the pen off the paper and sending the appropriate commands to the stepper motors. Moving the pen when it was down on the paper would draw a line from the current point to the new point.
When graphics packages designed for plotters were ported to pixel-based computer screens, the old terminology came along with it. The graphics package automatically keeps track of the current point (the current pixel location). The moveto function resets the coordinates of the current point:
void moveto(int x, int y)
The coordinates of the current point are set to (x, y). Note that nothing actually moves; the terminology is metaphorical.
The lineto function draws a line from the current point to the specified point:
void lineto(int x, int y)
When the lineto function terminates, the coordinates of the current point are set to (x, y) just as if a physical pen had drawn the line.
In the code below, the moveto and lineto functions are used to draw our square.
     // Draw a white square in the center of the screen.

    setcolor(WHITE);
    moveto( 50, 50);   // move to the first vertex
    lineto(150,  50);  // top
    lineto(150, 150);  // right side
    lineto( 50, 150);  // bottom
    lineto( 50,  50);  // left side
On a plotter, the line function consisted of moving the pen to the starting endpoint and then drawing a line from that point to the second endpoint. The current position of the pen following this operation is the second endpoint. The same is true of the line function in our graphics package.
Here is another algorithm for drawing our rectangle:
The linerel function draws a line from the current point to a point specified by increments in the horizontal and vertical directions:
void linerel(int dx, int dy)
This function draws a line from the current point (x, y) to the point (x + dx, y + dy). Following this operation, the current point is set to the second endpoint. The following code uses relative line drawing to draw our square.
     // Draw a white square in the center of the screen.

    setcolor(WHITE);
    moveto(   50,   50);  // move to the first vertex
    linerel( 100,    0);  // top
    linerel(   0,  100);  // right side
    linerel(-100,    0);  // bottom
    linerel(   0, -100);  // left side
Our final algorithm is this:
Draw a poly-line (a multi-segmented line) from (50, 50) to (150, 50) to (150, 150) to (50, 150) and back to (50,50).
The polydraw function has two parameters: the number of points and a one-dimensional array of integer coordinates. The number of values in the array is two times the number of points (i.e., two coordinates for each point). The first two coordinates in the array represent the beginning point, the next two coordinates represent the second point, and so on. The last two coordinates represent the final point. For a closed figure like our square, the first point and the final point are the same.
     // Draw a white square in the center of the screen.

    setcolor(WHITE);
    int coord[10] = {50, 50, 150, 50, 150, 150, 50, 150, 50, 50};
    drawpoly(5, coord);