
These are the solutions to the loan exercises. You are strongly advised to work out your own solutions before you look at these.
1. A man takes out a loan of $5,000 at 11.6% compounded quarterly for 4 years.
A. How large are his quarterly payments?
The quarterly payment will be $395.02 (rounded to the nearest penny).
B. How much interest will he pay?
Based on the formula, the total interest paid will be $1,320.32.
C. Find the annual percentage rate.
The effective annual interest rate is 12.114% (rounded to 3 decimal places).
Calculator solution for A, B and C
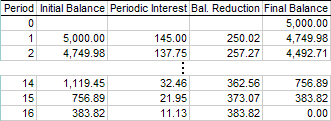
D. Prepare an amortization table. Remember that the balance reduction is the periodic payment minus the periodic interest. The balance reduction in the last row is set equal to the initial balance which may make the last payment a little bigger or smaller than the rest.
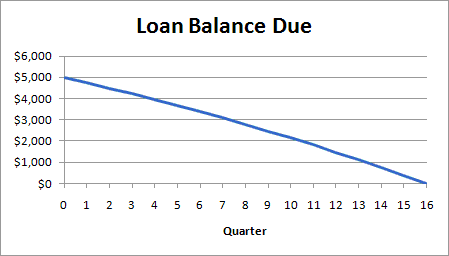
E. Create a line graph illustrating the decline in the balance due.
2. A couple takes out a 30-year mortgage of $100,000 at 9.6% compounded monthly.
A. What is the size of their monthly payment?
Their monthly payment will be $846.16 (rounded to the nearest penny).
B. How much interest will they pay?
Based on the formula, the total interest paid will be $205,337.60.
C. Find the annual percentage rate.
The effective annual interest rate is 10.034% (rounded to three decimal places).
Calculator solution for A, B and C
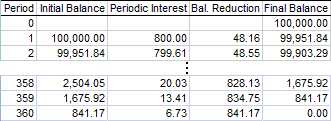
D. Prepare an amortization table. Remember that the balance reduction is the periodic payment minus the periodic interest. The balance reduction in the last row is set equal to the initial balance which may make the last payment a little bigger or smaller than the rest.
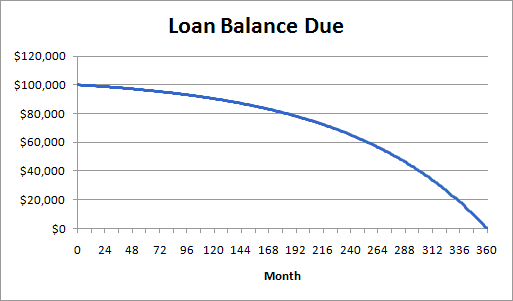
E. Create a line graph illustrating the decline in the balance due.
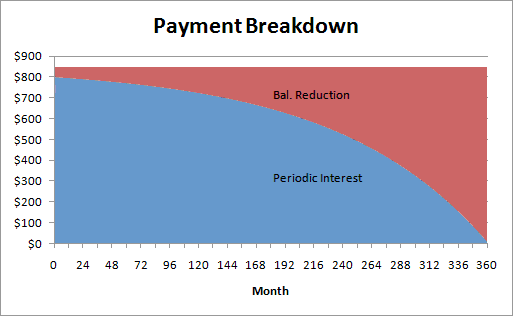
F. Create an area graph that illustrates how each payment is divided between interest and balance reduction.
3. Repeat problem 2 with an interest rate of 8.6% compounded monthly.
A. What is the size of their monthly payment?
Their monthly payment is $776.01 (rounded to the nearest penny). They save a little more than $70 a month.
B. How much interest will they pay?
Based on the formula, the total interest paid will be $179,363.60. Notice that the total interest has been reduced by more than $25,000!
C. Find the annual percentage rate.
The effective annual interest rate is 8.947% (rounded to three decimal places).
Calculator solution for A, B and C
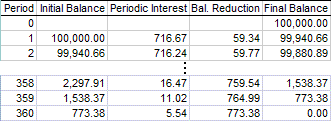
D. Prepare an amortization table. Remember that the balance reduction is the periodic payment minus the periodic interest. The balance reduction in the last row is set equal to the initial balance which may make the last payment a little bigger or smaller than the rest.
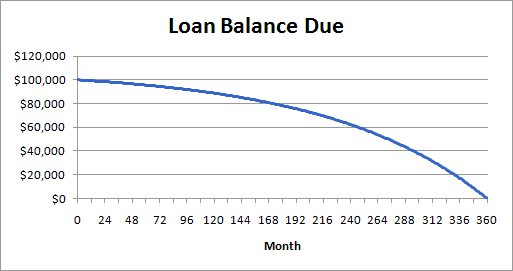
E. Create a line graph illustrating the decline in the balance due.
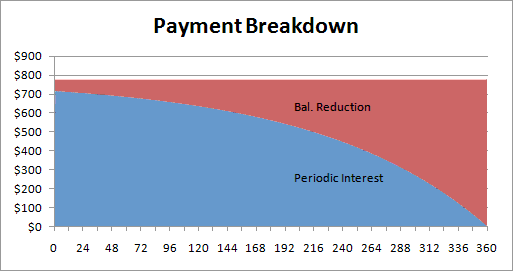
F. Create an area graph that illustrates how each payment is divided between interest and balance reduction.
4. Repeat problem 2 but with a 25-year term.
A. What is the size of their monthly payment?
Their monthly payment is $880.66 (rounded to the nearest penny) or about $32 more per month than with the 30-year mortgage.
B. How much interest will they pay?
Based on the formula, the total interest paid will be $164,198.00. Notice that while the mortgage payments are about $32 more per month, the total interest has been reduced by more than $41,000.
C. Find the annual percentage rate.
The effective annual interest rate is 10.034% (rounded to three decimal places).
Calculator solution for A, B and C
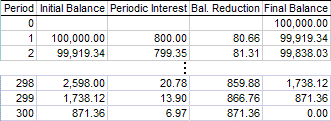
D. Prepare an amortization table. Remember that the balance reduction is the periodic payment minus the periodic interest. The balance reduction in the last row is set equal to the initial balance which may make the last payment a little bigger or smaller than the rest.
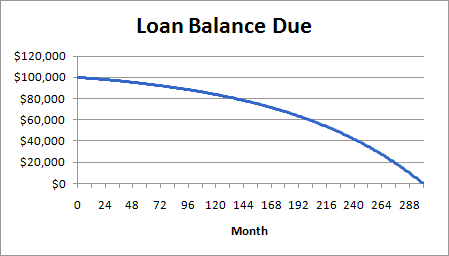
E. Create a line graph illustrating the decline in the balance due.
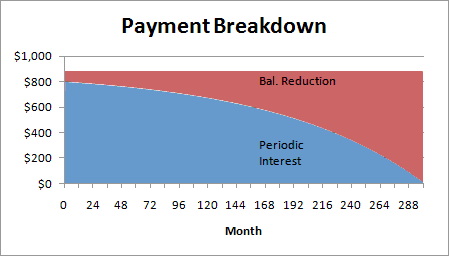
F. Create an area graph that illustrates how each payment is divided between interest and balance reduction.
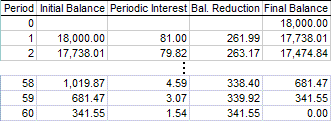
5. A woman borrows $18,000 to buy a new car. She pays 5.4% compounded monthly for five years.
A. What is the size of her monthly payment?
Her monthly payment will be $342.99 (rounded to the nearest penny).
B. How much interest will she pay?
Based on the formula, the total interest paid will be $2,579.40.
C. Find the annual percentage rate.
The effective annual rate is 5.536% (rounded to the nearest 3 decimal places).
Calculator solution for A, B and C
D. Prepare an amortization table. Remember that the balance reduction is the periodic payment minus the periodic interest. The balance reduction in the last row is set equal to the initial balance which may make the last payment a little bigger or smaller than the rest.
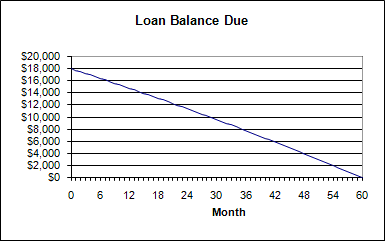
E. Create a line graph illustrating the decline in the balance due.
6. A couple invest $1,000 every six months for 30 years into a retirement account earning 4.7% compounded monthly. At the end of that time they plan to withdraw a fixed amount each six months for 20 years at which time the account balance will be reduced to zero.
This is really a two-part problem. The first part is a 30-year savings plan. The second part is, mathematically, a loan problem where the bank is the borrower and is sending monthly payments to the couple. The future value of the savings plan is the present value of this loan.
A. How much will they be able to withdraw every six months.
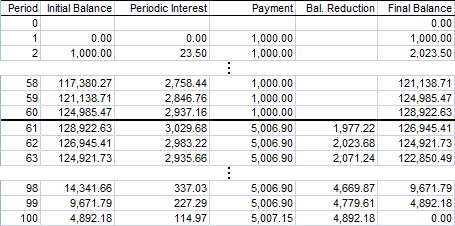
They will be able to withdraw $5,006.90 every six months for 20 years.
B. How much total interest will they earn throughout the 50-year span?
They will earn a total of $140,276.00 in interest over the 50-year span; $68,922.66 during the first 30 years and $71,353.34 during the 20 years following retirement. (Based on the tables, they will actually earn $140,276.25.)
C. Find the annual percentage yield for this investment.
The annual percentage yield for this investment is 4.755%.
Calculator solution for A, B and C
D. Prepare a table that shows the change in the account balance over the entire 50-year span.
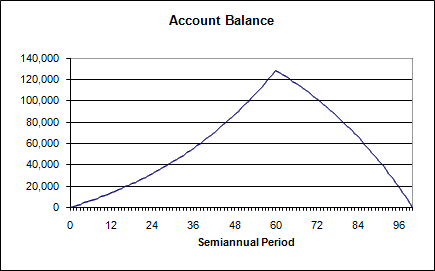
The first 30 years (60 semiannual periods) represents a regular savings plan in which the account balance grows. Starting with the 61st period, the couple starts withdrawing $5,006.90 at the end of every 6 months. This can be thought of as the bank repaying a loan. The balance in the account constantly shrinks.
E. Create a line graph illustrating the change in the account balance over the entire 50-year span. The account balance grows for the first 30 years (60 periods) and shrinks for the last 20 years (40 periods).
