

These examples are continuations of the summarizing data examples in an earlier section. The calculation of the mean and standard deviation by hand is tedious. The tables in the examples below were generated using spreadsheet software and illustrate the steps needed to calculate these statistics. As you might expect, spreadsheet software includes functions that will calculate all of these statistics for us without the need for us to sort the data or create the tables.
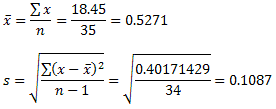
In a random sample of 35 teenage drivers, the reaction time (in seconds) for each driver was measured with the results shown below. Find the five-number summary and the mean and standard deviation.
1. For a sample with an odd number of observed outcomes (35 in this example), the median is the middle value in the sorted list of values.
median = x[(n+1)/2] = x[18] = 0.55
0.25, 0.35, 0.35, 0.40, 0.40, 0.45, 0.45, 0.45, 0.45, 0.45, 0.50, 0.50, 0.50, 0.50, 0.50, 0.50, 0.55, 0.55, 0.55, 0.55, 0.55, 0.55, 0.55, 0.55, 0.60, 0.60, 0.60, 0.60, 0.60, 0.60, 0.60, 0.65, 0.65, 0.75, 0.80
The first quartile (0.45) is the 9th value (i.e., the middle value in the first 17 values) in the list.
0.25, 0.35, 0.35, 0.40, 0.40, 0.45, 0.45, 0.45, 0.45, 0.45, 0.50, 0.50, 0.50, 0.50, 0.50, 0.50, 0.55, 0.55, 0.55, 0.55, 0.55, 0.55, 0.55, 0.55, 0.60, 0.60, 0.60, 0.60, 0.60, 0.60, 0.60, 0.65, 0.65, 0.75, 0.80
The third quartile (0.60) is the 27th value (i.e., the middle value of the last 17 values) in the list.
0.25, 0.35, 0.35, 0.40, 0.40, 0.45, 0.45, 0.45, 0.45, 0.45, 0.50, 0.50, 0.50, 0.50, 0.50, 0.50, 0.55, 0.55, 0.55, 0.55, 0.55, 0.55, 0.55, 0.55, 0.60, 0.60, 0.60, 0.60, 0.60, 0.60, 0.60, 0.65, 0.65, 0.75, 0.80
The five-number summary is: 0.25, 0.45, 0.55, 0.60, 0.80
2. Find the sum of the data values and calculate the mean. Use the mean to find the deviations and the squares of the deviations. Find the sum of the squares of the deviations and calculate the standard deviation. In the table below, I have also found the sum of the deviations just to help convince you that the sum of the deviations is always zero.

Use these values to calculate the mean and the standard deviation:
The number of M&Ms in 30 bags was counted with the results shown below. Find the five-number summary and the mean and standard deviation.
1. For a sample with an even number of observed outcomes (30 in this example), the median is the average of the two middle scores.
x[n/2] = x[15] = 57
x[n/2 + 1] = x[16] = 57median = (57 + 57)/2 = 57
54, 55, 55, 55, 55, 56, 56, 56, 56, 56, 56, 57, 57, 57, 57, 57, 57, 57, 57, 58, 58, 58, 58, 58, 58, 58, 59, 59, 59, 59
The first quartile (56) is the 8th value (i.e., the middle value in the first 15 values) in the list.
54, 55, 55, 55, 55, 56, 56, 56, 56, 56, 56, 57, 57, 57, 57, 57, 57, 57, 57, 58, 58, 58, 58, 58, 58, 58, 59, 59, 59, 59
The third quartile (58) is the 23rd value (i.e. the middle value in the last 15 values) in the list.
54, 55, 55, 55, 55, 56, 56, 56, 56, 56, 56, 57, 57, 57, 57, 57, 57, 57, 57, 58, 58, 58, 58, 58, 58, 58, 59, 59, 59, 59
The five-number summary is: 54, 56, 57, 58, 59
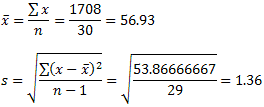
2. Find the sum of the data values and calculate the mean. Use the mean to find the deviations and the squares of the deviations. Find the sum of the squares of the deviations and calculate the standard deviation. In the table below, I have also found the sum of the deviations just to help convince you that the sum of the deviations is always zero.
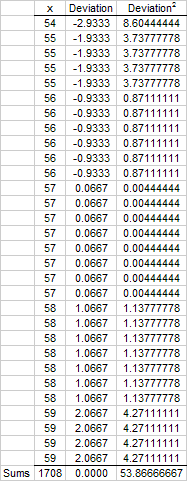
Use these values to calculate the mean and the standard deviation:
Early in the 19th century a study was done in which the chest sizes of 5,738 Scottish militiamen were measured (in inches). The data below represents a random sample of 28 of these militiamen. Find the five-number summary and the mean and standard deviation.
38, 42, 41, 40, 37, 41, 40, 38, 37, 38, 36, 38, 40, 38, 39, 39, 40, 39, 41, 39, 41, 42, 36, 38, 42, 42, 39, 36
1. Before we can find the five-number summary, the data must be sorted in ascending order. The median (39) is the average of the 14th and 15th values in this sorted list.
36, 36, 36, 37, 37, 38, 38, 38, 38, 38, 38, 39, 39, 39, 39, 39, 40, 40, 40, 40, 41, 41, 41, 41, 42, 42, 42, 42
The first quartile (38) is the average of the 7th and 8th values (i.e., the middle of the first 14 values) in the list.
36, 36, 36, 37, 37, 38, 38, 38, 38, 38, 38, 39, 39, 39, 39, 39, 40, 40, 40, 40, 41, 41, 41, 41, 42, 42, 42, 42
The third quartile (41) is the average of the 21st and 22nd values (i.e., the middle of the last 14 values) in the list.
36, 36, 36, 37, 37, 38, 38, 38, 38, 38, 38, 39, 39, 39, 39, 39, 40, 40, 40, 40, 41, 41, 41, 41, 42, 42, 42, 42
The five-number summary is: 36, 38, 39, 41, 42
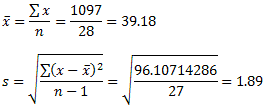
2. Find the sum of the data values and calculate the mean. Use the mean to find the deviations and the squares of the deviations. Find the sum of the squares of the deviations and calculate the standard deviation. In the table below, I have also found the sum of the deviations just to help convince you that the sum of the deviations is always zero.
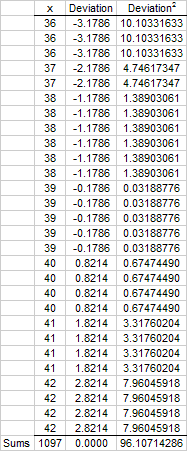
Use these values to calculate the mean and the standard deviation:
Calculating the standard deviation is particularly messy because finding each deviation requires a division operation which often results in values with many, many decimal places. If we just round these intermediate values off too much, the final result will not be correct. (In general, you should not round at all until you get to your final answer.) The formula for the standard deviation can be modified algebraically to a form that is much easier to use for calculating the standard deviation by hand. We are not going to investigate that formula because we will be using spreadsheet software to perform our calculations.