
In the previous section, you learned how to summarize data using a frequency distribution and a column chart. Descriptive statistics, as a field of study, is the branch of statistics that deals with collecting, summarizing, and analyzing data. Descriptive statistics, as numbers, summarize data numerically. There are two sets of descriptive statistics that are used to summarize data. The five-number summary can be used with any set of data. The mean and standard deviation are appropriate only for data whose values are normally distributed.
In general, descriptive statistics are generated using sample data in an effort to estimate the corresponding population parameter. For example, the sample mean (a sample statistic) is used as an estimate for the population mean (a population parameter). Similarly, the sample standard deviation (a sample statistic) is used to estimate the population standard deviation (a population parameter).
The five-number summary consists of five values: minimum, first quartile, median (second quartile), third quartile, and maximum. The minimum is the smallest value in the data set. The maximum is the largest value. Together, the minimum and maximum define the range of values in the data set.
The quartiles represent positions 25%, 50%, 75% through the sorted list. Twenty-five percent of the values in the data are less than or equal to the first quartile. Fifty percent of the values are less than or equal to the median (or second quartile). Seventy-five percent of the values are less than or equal to the third quartile.
Together, the first and third quartiles define the interquartile range. The middle fifty percent of the data values are in the interquartile range. The interquartile range is a measure of dispersion and indicates how spread out the data is.
The median is the middle value in the sorted list of outcomes. The median is a measure of central tendency and indicates the middle of the data set. The list below contains 25 outcomes sorted in ascending order. The middle one is the 13th outcome in the list (it is preceded by 12 outcomes and followed by another 12). The thirteenth value in the sorted list is 70. Thus, the median is 70 inches.
66, 67, 68, 68, 68, 68, 69, 69, 69, 69, 69, 69, 70, 70, 70, 70, 70, 71, 71, 71, 71, 72, 72, 72, 74
A list containing an odd number of elements always has an exact middle value. It's position (not its value) is given by the formula (n+1)/2 where n is the number of elements in the list. In our example, (n+1)/2 = (25+1)/2 = 26/2 = 13. The median is the 13th value in the sorted list.
A list containing an even number of elements has no middle element. Consider this list of 10 values.
6, 7, 7, 8, 8, 9, 9, 9, 9, 10
One might be tempted to say that the fifth value (the 8) is the middle value in the list. But there are only 4 values that come before and 5 values that come after. On the other hand, the sixth number (the first 9) isn't the middle value either since 5 values come before and only 4 values come after. Since there is no exact middle, the median is defined as the average of the two middle values. In our list of ten values, the two middle elements are the fifth and sixth with values 8 and 9 respectively (as illustrated below). The average of these two values is 8.5 so the median is 8.5.
6, 7, 7, 8, 8, 9, 9, 9, 9, 10
The table below summarizes the process of finding the median. The expression within the square brackets is a location in the sorted list of values. For example, x[5] would be the fifth value in the list.
n |
Median |
Example |
odd |
 |
|
even |
 |
The first quartile is the middle of the first n/2 (integer division) values in the sorted list of data (i.e., the middle of the first half of the list). The third quartile is the middle of the last n/2 values in the sorted list (i.e., the middle of the last half of the list).
Consider our first example above:
66, 67, 68, 68, 68, 68, 69, 69, 69, 69, 69, 69, 70, 70, 70, 70, 70, 71, 71, 71, 71, 72, 72, 72, 74
The first quartile is the average of the two middle values in the first 25/2 = 12 (integer division) values in the list (see below). Consequently, the first quartile is 68.5.
66, 67, 68, 68, 68, 68, 69, 69, 69, 69, 69, 69, 70, 70, 70, 70, 70, 71, 71, 71, 71, 72, 72, 72, 74
The third quartile is the average of the two middle values in the last 12 values in the list or 71.0.
66, 67, 68, 68, 68, 68, 69, 69, 69, 69, 69, 69, 70, 70, 70, 70, 70, 71, 71, 71, 71, 72, 72, 72, 74
The full five-number summary for this data set is 66, 68.5, 70, 71, 74. Approximately half of the values are in the range 68.5 to 71 (the interquartile range).
Our second example consisted of the following values: 6, 7, 7, 8, 8, 9, 9, 9, 9, 10
The first quartile is the middle value (7) in the first five values:
6, 7, 7, 8, 8, 9, 9, 9, 9, 10
The third quartile is the middle value (9) in the last five values:
6, 7, 7, 8, 8, 9, 9, 9, 9, 10
The five-number summary for this second set of data is 6, 7, 8.5, 9, 10. Approximately half of the values are in the range 7 to 9 (the interquartile range).
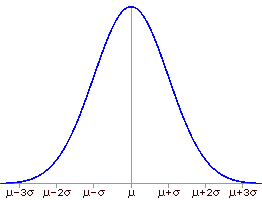
The mean and standard deviation are appropriate summaries for data whose values have a normal distribution. The mean is a measure of central tendency and the standard deviation is a measure of dispersion. These are the only two values needed to fully describe a normal distribution. In the image below, μ is the mean and σ is the standard deviation of a normally distributed population.

The mean is the arithmetic average and is found by dividing the sum of the observed outcomes by the number of observed outcomes. The mean of a sample is denoted by "x bar"; x with a line across the top. The mean of a population is denoted by the Greek letter mu (μ).

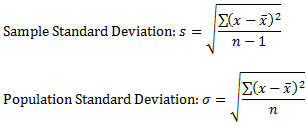
The standard deviation is a measure of dispersion. The larger the standard deviation, the more spread out the data is. The sample standard deviation is denoted by the letter s and the population standard deviation is denoted by the Greek letter sigma (σ). Notice that the definitions are slightly different.

See the page on the definition of standard deviation for more details.
While the significance of the mean is fairly obvious, the significance of the standard deviation is not. Suffice it to say for now that smaller values indicate that the data is more tightly clumped near the mean and larger values indicate that the data is more widely dispersed. Click here to see some examples. The real value of the standard deviation is its usefulness in calculating other statistics.