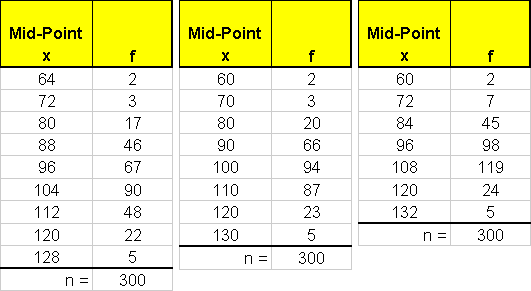

There is no one "correct" answer for the frequency distribution. Here are three grouped frequency distributions with interval widths of 8, 10, and 12 respectively.

The formula for the frequency (column f) for a given interval is
=COUNTIFS(range, ">="&(midpt - width/2), range, "<"&(midpt + width/2))
where range is the range of cells containing the data, midpt is the cell reference for the midpoint of the interval, and width is the width of the intervals (the distance between midpoints).
The formulas that should be entered in cell D4 for each of the frequency distributions above differ only in the width of the interval (remember that it is half of the width that is added or subtracted from the midpoint value). Here are the corresponding formulas:
=COUNTIFS(A$4:A$303, ">="&(C4-4), A$4:A$303, "<"&(C4+4))=COUNTIFS(A$4:A$303, ">="&(C4-5), A$4:A$303, "<"&(C4+5))=COUNTIF(A$4:A$303, ">="&(C4-6), A$4:A$303, "<"&(C4+6))
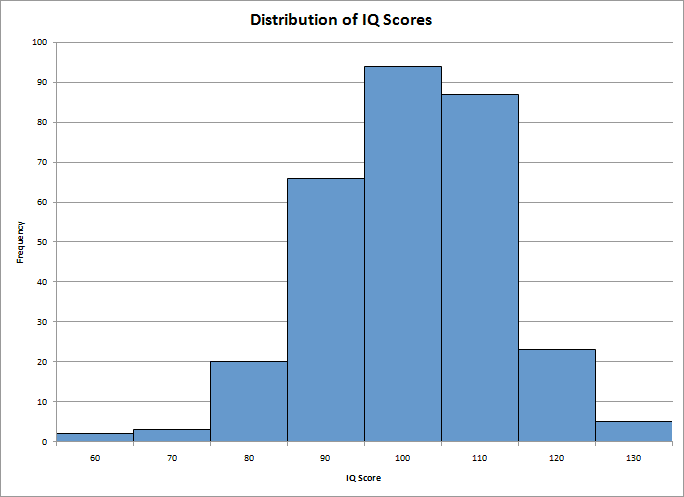
The histogram below was generated using the second grouped frequency distribution above (with an interval width of 10). Yours should look similar (though it may have a different number of intervals and/or different midpoints). The distribution is approximately normal.
