If you haven't already done so, you'll need to read the material on computer simulation.
Suppose that a professional basketball player, over her career, has made 90% of her free throws. Let's simulate a game in which she goes to the free throw line 20 times and compare the simulated empirical probabilities with the theoretical probabilities.
Based on her past performance, the theoretical probability that she'll make a free throw is 0.9 and the theoretical probability that she will miss is 0.1.
If X refers to a cell containing a random value between 0 and 1, the Excel expression for simulating a single free throw is given here:
=IF(X<0.9, "Made", "Missed")
1. Download and open the file, Lab09.xlsx. Remind me how. Enter your name in cell B1 of the free throw worksheet.
2. Enter the following formula in cell A4 and copy it down the column until it appears in 20 rows.
=RAND()
3. Enter the following Excel formula into cell B4:
=IF(A4<0.9, "Made", "Missed")
If the random number in cell A4 is less than 0.90 then the text "Made" will appear in the cell. Otherwise, the text "Missed" will appear in the cell.
4. Copy the formula in cell B4 down the column an additional 19 rows (20 rows altogether). These 20 cells represent our simulation of the 20 free throws she attempts during the game.
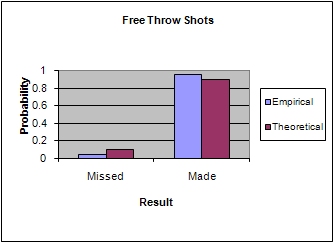
5. Complete the body of the probability table just as you did in the previous lab. The table should be formatted as shown below (your empirical probability values may differ).
6. Generate a chart comparing the empirical and theoretical probabilities. In step one of the chart wizard, make sure that Excel knows that in your data range, the series are in columns not rows. Your chart should look something like this:
You can check your work by looking at my workbook.
Suppose that the proportion of female students at Asbury College is 0.55 and the proportion of male students is 0.45. Simulate a simple random sample of 100 students and create a column chart that compares the empirical gender probabilities with the theoretical values. Format the probability table as you did in the previous problem.
You can check your work by looking at my workbook.
Suppose that the proportion of voters in the country who approve of the way the president is running the country is 0.5, the proportion who disapprove is 0.4, and the proportion who are undecided is 0.1. Simulate a simple random sample of 1,000 voters and create a column chart that compares the empirical probabilities with the theoretical values.
This simulation is a little more difficult since there are three possible outcomes. Here are the corresponding theoretical probabilities: P1 = 0.5, P2 = 0.4, and P3 = 0.1.
If X represents a random number between zero and one, we can use Excel's IF() function to implement this logic:
=IF(X<0.5, "Approve", IF(X<0.9, "Disapprove", "No Opinion"))
Simulate a poll of 1,000 voters and generate a chart comparing the empirical and theoretical probabilities.
You can check your work by looking at my workbook.
Simulate an experiment that consists of spinning the spinner shown below 1000 times and generate a chart comparing the empirical and theoretical probabilities.

For the geometrically challenged among you, I have provided some help in figuring out the probabilities of the four outcomes. If you can't figure it out for yourself, click on the following link: Help