
An octahedral die has 8 sides numbered 1 to 8:

An experiment consists of rolling a pair of octahedral dice and finding the dot sum. Simulate 5,000 trials of this experiment, draw a column chart illustrating the theoretical and empirical probabilities, and find the expected value based on the empirical probabilities and the expected value based on the theoretical probabilities.
1. Download and open the file, Lab10.xlsx. Remind me how. Enter your name in cell B1 of the octahedral dice worksheet.
2. In column A, simulate 5,000 rolls of a pair of octahedral dice (using the same techniques you used in Lab 8 to simulate rolling a pair of normal dice).
3. The possible dot sums range from 2 to 16. Find the corresponding frequencies in column D.
4. Using Excel expressions, find the corresponding empirical probabilities in column E.
5. Find and enter the theoretical probabilities in column F.
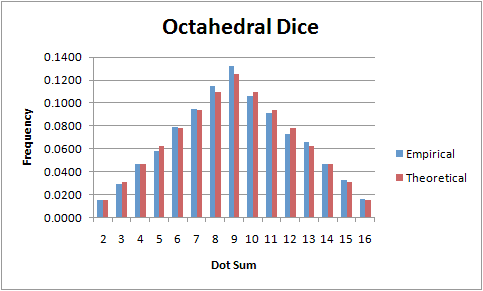
6. Draw a column chart to illustrate the empirical and theoretical probabilities. Your chart should look a lot like this:

There are two ways to calculate the expected value. The first approach is a straightforward implementation of the expected value as the sum of the products of the outcomes and the corresponding probabilities. Since this sum has 15 terms, it is somewhat tedious to enter. For the expected outcome based on the empirical probabilities (cell E23):
EV (empirical) = 2*P(2) + 3*P(3) + 4*P(4) + ... + 16*P(16)
               = C5*E5  + C6*E6  + C7*E7  + ... + C19*E19
While this expression will certainly work, it pays to think ahead a little. The formula for the expected value based on the theoretical probabilities (in cell F23) will be exactly the same except the theoretical probabilities are in column F rather than column E:
EV (theoretical) = 2*P(2) + 3*P(3) + 4*P(4) + ... + 16*P(16)
                 = C5*F5  + C6*F6  + C7*F7  + ... + C19*F19
Notice, in particular, that the references for the outcomes are the same as before (i.e., they are always in column C). Consequently, we should enter the first formula as follows:
EV (empirical) = 2*P(2)  + 3*P(3)  + 4*P(4)  + ... + 16*P(16)
               = $C5*E5  + $C6*E6  + $C7*E7  + ... + $C19*E19
or
               = $C$5*E5 + $C$6*E6 + $C$7*E7 + ... + $C$19*E19
Notice that while it is not necessary to make the row references absolute (as was done in the second version), it doesn't hurt to do so. By using absolute references for the outcomes in row C, we can copy the formula from cell E23 to F23 and get the correct results with no modifications.
The second approach to calculating the expected value is to use an array formula. In earlier labs, you used an array formula to fill an array of cells with values based on the values in one or more other arrays. For example, we could calculate the array of products (of the outcomes and the corresponding probabilities) using this array formula:
=C5:C19*E5:E19 Shift-Ctrl-Enter
To use this formula, we would have to highlight a parallel column, enter the formula, and then add up the products to find the sum. In reality, however, there is no need to actually display all of these products. Excel allows us to find the sum using the sum function:
=SUM(C5:C19*E5:E19) Shift-Ctrl-Enter
This means multiply the values in cells C5 through C19 by the corresponding values in cells E5 through E19 and add up the results. As before, it is best to think ahead and use absolute references for the outcome cell references:
       =SUM($C5:$C19*EF:E19) Shift-Ctrl-Enter
or
      =SUM($C$5:$C$19*EF:E19) Shift-Ctrl-Enter
7. In cell E23, enter the formula for the expected value based on empirical probabilities (using either approach described above). You should get a result in the neighborhood of 9.0.
8. Copy the formula in cell E23 into cell F23. If you used absolute cell references correctly, you should get exactly 9.0.
An experiment consists of spinning the spinner shown below. Simulate 5,000 trials of this experiment, draw a column chart illustrating the theoretical and empirical probabilities, and find the expected value based on the empirical probabilities and the expected value based on the theoretical probabilities. If necessary, go back to Lab 9 to review the steps needed to simulate an experiment with outcomes that are not equally likely.
Sector  Central Angle
   2         30
   3        135
   4         45
   5         60
   6         90