

1. A campus organization has 30 members including Alice, Bob, and Carla.
a. A slate of officers (president, vice-president, and secretary) is selected selected at random. How many different slates of officers are possible? What is the probability that Alice will be the candidate for president, Bob will be the candidate for vice-president, and Carla will be the candidate for secretary?
There are 24,360 possible slates of officers:
P30,3 = 30*29*28 = 24,360
The event is the selection of the slate of officers Alice, Bob, and Carla. The sample space is the set of all possible slates of officers.
![]()
There is only one favorable slate (Alice, Bob, and Carla) out of 24,360 possible slates.
You can also find the probability using the only path in the tree diagram that leads to a favorable outcome (without drawing the entire diagram):
![]()
b. A committee of three is selected at random. How many different committees are possible? What is the probability that Alice, Bob, and Carla will be on the committee?
There are 4,060 different committees possible:
C30,3 = (30*29*28)/(3*2*1) = 4,060
The event is the selection of a committee consisting of Alice, Bob, and Carla. The sample space is the set of all possible three-member committees.

There is only one favorable committee (the one containing Alice, Bob, and Carla) out of 4,060 possible committees.
You can also find the probability using the paths that lead to successful outcomes in the tree diagram (without showing the paths to all of the unsuccessful outcomes):
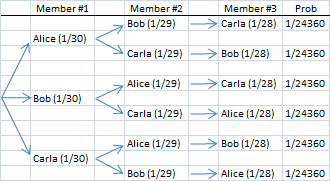
The sum of the probabilities of successful outcomes is 6/24360 = 1/4060
c. A committee of four is selected at random. How many different committees are possible? What is the probability that Alice, Bob, and Carla will be on the committee?
There are 27,405 possible committees:
C30,4 = (30*29*28*27)/(4*3*2*1) = 27,405
The event is a committee that includes Alice, Bob, and Carla. The sample space is the set of all possible committees.

There are 27 favorable outcomes (the number of other people that could serve as the fourth committee member) out of 27,405 possible committees.
You could find this probability using a tree diagram but even if you drew only the favorable paths, there would be 27 of them and it would take too much time.
2. A monkey is given 7 wooden blocks with the letters "ABLLNOO" (one letter per block). If the monkey lines up the blocks randomly, what is the probability that the blocks would spell the word "BALLOON"?
The event is the spelling of the word "BALLOON". The sample space is the set of all possible different-looking arrangements of the seven letters.

There is only one favorable outcome; the word "BALLOON". There are 1,260 possible words (different-looking arrangements of the seven letters).
You can also solve this problem by looking at the only path in the tree diagram that leads to a successful outcome (without drawing the entire diagram):
![]()
P("BALLOON") = 4/5040 = 1/1260 ≈ 0.000794
3. An urn contains eight white balls and two green balls. A sample of three balls is selected at random without replacement.
Since the sample is selected without replacement, the selections are dependent events. The probabilities for each selection after the first depend on what was drawn in previous selections.
a. Draw a tree diagram for this experiment.
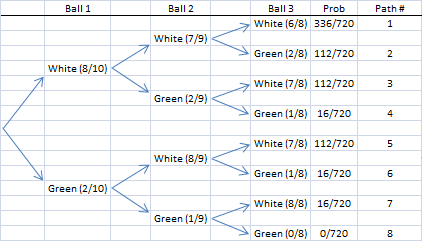
b. Find the probability that all three balls will be white.
P(All White) = 336/720 ≈ 0.467
This corresponds to the first path in the tree diagram.
c. Find the probability that at least one ball will be green.
P(At Least 1 Green) = 1 - P(All White) = 1 - 336/720 = 720/720 - 336/720 = 384/720 ≈ 0.533
This result corresponds to the last seven paths in the tree diagram. The sum of those probabilities is 384/720.
d. Find the probability that the third ball was white given that the first ball was green.

The numerator corresponds to paths 5 and 7 along which the first ball was green and the third ball was white. The denominator corresponds to paths 5 through 8 along which the first ball was green. Observe that the sum of the probabilities for the last four paths is 144/720 = 0.2. (We didn't need to do this arithmetic because we were given the probability that the first ball was green. But it's nice to know that the calculation gives us the correct result.)
e. Find the probability that the first ball was white given that the third ball was green.

The numerator corresponds to paths 2 and 4. The denominator corresponds to paths 2, 4, 6, and 8.
4. Repeat number three assuming that the sample is selected with replacement.
Since the sample is selected with replacement, the selections are independent events. The probabilities for each selection after the first do not depend on what was drawn in previous selections.
a. Draw a tree diagram for this experiment.
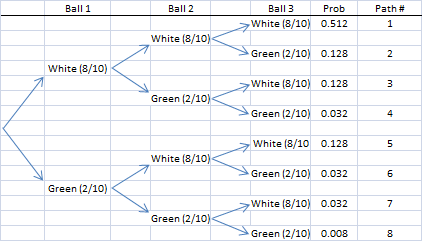
b. Find the probability that all three balls will be white.
P(All White) = 0.512
This corresponds to the first path in the tree diagram.
c. Find the probability that at least one ball will be green.
P(At Least One Green) = 1 - P(All White) = 1 - 0.512 = 0.488
This result also corresponds to the last seven paths in the tree diagram. The sum of those probabilities is 0.488.
d. Find the probability that the third ball was white given that the first ball was green.
![]()
The numerator corresponds to paths 5 and 7 along which the first ball was green and the last ball was white. The denominator is the probability that the first ball was green.
The denominator also corresponds to paths 5 through 8 along which the first ball was green. Note that the sum of the probabilities for the last four paths is 0.200.
e. Find the probability that the first ball was white given that the third ball was green.
![]()
The numerator corresponds to paths 2 and 4 along which the first ball was white and the third ball was green. The denominator corresponds to paths 2, 4, 6, and 8 along which the third ball was green.
5. The table below gives the probability distribution of income levels and shows the proportion of families at each income level that own two or more cars.
| Annual Family Income | Probability | Proportion of Families with Two or More Cars |
| < $30,000 | 0.10 | 0.20 |
| $30,000 to $44,999 | 0.20 | 0.50 |
| $45,000 to $59,999 | 0.35 | 0.60 |
| $60,000 to $74,999 | 0.30 | 0.75 |
| ≥ $75,000 | 0.05 | 0.90 |
The proportion of families with two or more cars is the probability. Both are found by dividing the number of favorable outcomes by the total number of outcomes.
a. Draw the tree diagram for this table.
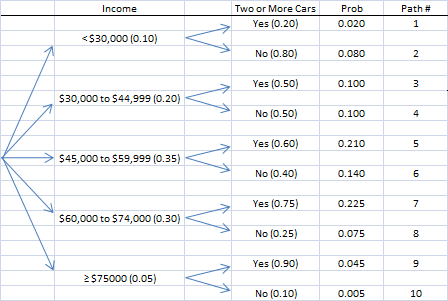
b. Find the probability that a randomly selected family has two or more cars.
P(2+) = 0.020 + 0.100 + 0.210 + 0.225 + 0.045 = 0.600
These probabilities correspond to paths 1, 3, 5, 7, and 9 (paths along which the family owns two or more cars).
c. Find the probability that a randomly selected family has two or more cars given that family income is greater than or equal to $45,000.
![]()
The numerator corresponds to paths 5, 7, and 9 where the income is greater than $45,000 and the family owns two or more cars. The denominator corresponds to paths 5-10 where the income is greater than $45,000. (Observe that for the denominator, you could add the last three probabilities in the income column rather than the last six probabilities in the final column and get the same result.)
d. Find the probability that a randomly selected family has an income between $30,000 and $59,999 given that it does not have two or more cars.

The numerator corresponds to paths 4 and 6 where the income is between $30,000 and $59,999 and the family does not own two or more cars. The denominator corresponds to rows 2, 4, 6, 8, and 10 where the family does not own two or more cars.
In this case, the denominator could be found more easily by using the property that P(A) = 1 - P(A') where A, in this case, is not having two or more cars and A' is having two or more cars:
P(<2) = 1- P(2+) = 1.000 - 0.600 (from part b) = 0.400
6. A men's soccer team plays 0, 1, or 2 games a week. The probability that they play 0 games is 0.2, the probability that they play 1 game is 0.5, and the probability that they play 2 games is 0.3. On average, how many games do they play per week?
The average number of games is the expected value:
0*0.2 + 1*0.5 + 2*0.3 = 0 + 0.5 + 0.6 = 1.1 games per week
7. A special six-sided die has one dot on one face, two dots on two faces, and three dots on three faces. In an experiment, two of these dice are rolled and the dot sum is found. What is the expected value for the dot sum?
A tree diagram can be used to find the expected value:
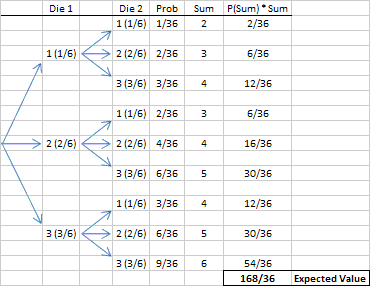
You could also use the tree diagram to find the probabilities for the possible sums (2 to 6) and use those probabilities to find the expected value:
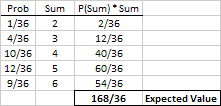
You could even generate an appropriate addition table and find the average of all 36 possible dot sums:
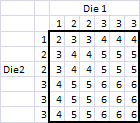
Given the answers above, it should come as no surprise that the sum of all 36 entries in the addition table is 168 and, consequently, the average is 168/36.
8. On an Excel worksheet, simulate 500 spins of the spinner shown below, generate a column chart comparing the empirical and theoretical probabilities and find the expected value of an experiment consisting of a single spin of this spinner.
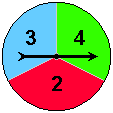
For the solution, see my worksheet: Test4Sim.xlsx.
9. On an Excel worksheet, simulate 500 spins of the spinner shown below, generate a column chart comparing the empirical and theoretical probabilities and find the expected value of an experiment consisting of a single spin of this spinner.
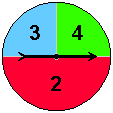
For the solution, see my worksheet: Test4Sim.xlsx.