
One of the meanings of the word "per" is "for each". For example, if a car is traveling 55 miles per hour, that means that the car goes 55 miles for each hour of travel. To say that gasoline costs $3.95 per gallon means that gas costs $3.95 for each gallon purchased.
The word "percent" is a contraction of the the Latin phrase "per cent" which means "per hundred" or "for each hundred". Consequently, to say that the price increased by 5 percent means that the price increased by 5 per hundred or 5 for each hundred. That is, the price went up 5¢ for each 100¢ or $5 for each $100, or €5 for each €100 (€ indicates Euros).
When "per" is used in this way, the word "per" is often replaced by the '/' character:
The word "percent" is often replaced by the '%' character. For example, 5 percent is often written 5%. Combining the definition of percent, the symbol for "percent" and the symbol for "per" we get these equivalences:
To convert from percent to the decimal equivalent, divide by one hundred:
To convert from decimal equivalent to percent, multiply by one hundred:
![]()
![]()
Problems of this type involve an original (or base) value, a new value, and the change between the two. If the difference between the two is expressed as a percentage of the original value then the magnitude of the change must be calculated. If the magnitude of the change is known then the percent of increase or decrease must be calculated. Mathematically, problems of this type can be summarized as follows:
vnew = vold + change
where vold is the original value, vnew is the new value, and change represents the increase or decrease in the original value. The change is positive if the new value is greater than the old and the change is negative if the new value is less than the old. The change in the value is the original value times the decimal equivalent of the percent of change (r):
change = r*vold
Substituting this expression for change in the first equation yields
vnew = vold + rvold = vold(1 + r)
where r is the decimal equivalent of the percent of change. A positive percent of change represents an increase in the value and a negative percent of change represents a decrease.
Suppose the population of a small town increased by 6.3% between the 2000 census and the 2010 census. If the population in 2000 was 4,583 then what was the magnitude of the population change and what was the population in 2010?
In this example, the original value is the population of the town in 2000, the new value is the population in 2010, and the percentage increase in population from 2000 to 2010 is given. To find the population in 2010, we first need to find the magnitude of the change:
change = rvold = 0.063 * 4583 = 289 people
From 2000 to 2010, the population increased by 289 people. Consequently, the population in 2010 is given by:
vnew = vold + change = 4583 + 289 = 4872 people
Now, suppose the population of some other town was 9,238 in 2000 and declined to 8,783 by 2010. What was the percent of decrease? This problem is a bit more difficult but is based on the same basic principles outlined above. First, find the change:
If
  vnew = vold + change
then
  change = vnew - vold = 8783 - 9238 = -455 people
Keeping in mind that this change is the original value times the decimal equivalent of the percent of change we can find the percent of change:
If
  change = rvold
then
  r = change/vold = -455/9238 = -0.048777873 ≈ -4.9%
Remember that a negative percent rate of change indicates that the value decreases. That is, the population of this town decreased by approximately 4.9% from 2000 to 2010.
![]()
![]()
For federal income tax purposes, you will file a tax return with one of the following statuses:
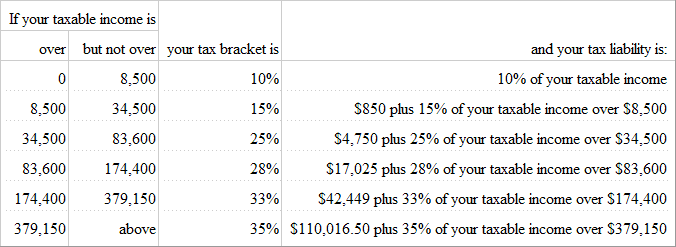
The table below illustrates the federal tax brackets for 2011 for a taxpayer whose filing status is as a single person. The tax brackets for the other filing statuses are similar but have different cutoffs.
| If your taxable income is | ||
| over | but not over | your tax bracket is: |
| 0 | 8,500 | 10% |
| 8,500 | 34,500 | 15% |
| 34,500 | 83,600 | 25% |
| 83,600 | 174,400 | 28% |
| 174,400 | 379,150 | 33% |
| 379,150 | above | 35% |
This table requires a little explanation. When calculating income tax, dollar amounts (i.e., taxable income and the tax you owe) are rounded to the nearest penny. Consequently, the amounts shown in tax brackets (and tax tables) are always expressed in whole dollars rather than dollars and cents.
Think of your taxable income as a bunch of $1 bills lined up end to end:
![]()
In most cases, the taxable income is more than $9 so let's zoom out a little:
![]()
A taxable income of $36 is still awfully small so let's zoom out so far that we can't make out the individual dollars.
![]()
Now, let's suppose that your taxable income is only $42,593. Starting at the left end of your line of dollars, for each dollar from dollar 1 through dollar 8,500, the federal government takes 10¢; a total of $850. That's 10% of the first $8,500 of your taxable income.
For each dollar from dollar 8,501 through dollar 34,500, the federal government takes 15¢; a total of $3,900. That's 15% of 34,500 minus 8,500 or, put another way, that is 15% of the next $26,000 of your taxable income.
For each dollar from dollar 34,501 through dollar 42,593, the federal government takes 25¢; a total of $2,023. That's 25% of 42,593 minus 34,500 or, put another way, that is 25% of the next (and final) $8,093 of your taxable income.
Your total tax liability would be $850 + $3,900 + $2,023 or $6,773. You are in the 25% tax bracket because that was the tax rate used for the last dollar you earned. This is also referred to as your marginal tax rate. Note that your overall tax rate is typically less than your tax bracket. Your overall tax rate is your tax liability divided by your taxable income with the result expressed as a percent. In this example, your overall tax rate is 6773/42593 or 15.9%.
While the tax brackets can be used to calculate a person's tax liability, as illustrated above, the federal government knows that doing so is too difficult for many taxpayers. One solution is to provide a tax table that significantly reduces the amount of work one must do to calculate the tax liability. This table is based on the fact that anyone in a given tax bracket, will pay exactly the same amount for the earnings in the lower tax brackets. Based on our calculations above, for example, anyone in the 25% tax bracket will owe $850 in tax on the first $8,500 of income and $3,900 on the next $26,000 of income. Collectively, that means that any taxpayer in the 25% tax bracket will owe a total of $4,750 on the first $34,500 of taxable income. To that, the taxpayer must add 25% of the rest of his or her income (everything over $34,500). Don't forget that if a person is in the third tax bracket we already know they made $83,600 or less.
Using these concepts, a tax table can be created in which a taxpayer must calculate only the additional tax liability for that portion of taxable income that falls within the taxpayer's tax bracket. The calculations for the lower tax brackets have already been done. For example, the tax table below could be used to calculate the tax liability for the tax brackets given above.
For our taxpayer with $42,593 of taxable income, the calculations required to find the tax liability has been simplified to just:
4,750 + 0.25 (42,593 - 34,500) = $6,773 (rounded to the nearest penny)
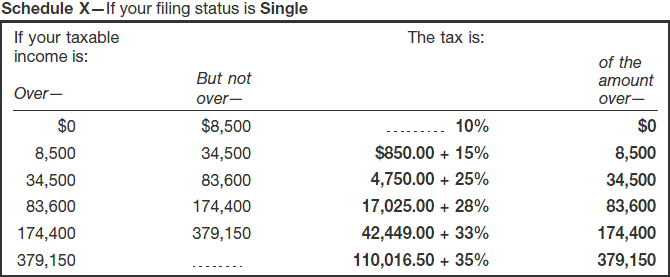
The Internal Revenue Service (IRS) refers to this kind of table as a tax rate schedule. Here is an example taken directly from an IRS document for 2011:
A table like this can also be used by employers to determine how much federal tax should be withheld from an employee's pay check. The following link takes you to an IRS instruction manual for employers. If you go to page 36 of the manual, you'll see tables very similar to the one shown above.
https://www.irs.gov/pub/irs-pdf/p15.pdf
Unfortunately, a significant number of taxpayers find even this simplified tax rate schedule too difficult to use. In fact, the tax payer is instructed to not use the tax rate schedule to calculate his or her tax liability. Instead, the IRS provides tax tables (see 2011 tax table) that require no calculations at all. The table consists of a large number of income intervals. All the taxpayer has to do is find the correct interval and read the tax liability from the table. Here is a very small excerpt from the IRS tax tables for 2011:
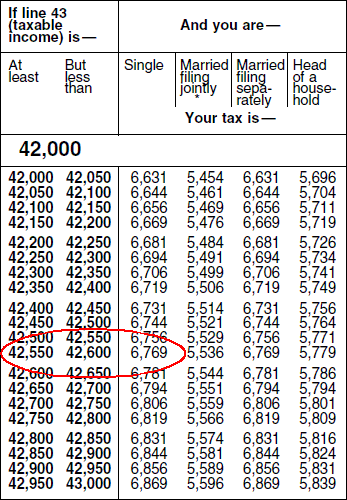
In our example, the taxpayer's taxable income was $42,593 which is in the interval from 42,550 to 42,600. Based on the table, the tax liability for a single person is $6,769. If you do the arithmetic, you will find that this is the tax liability for a taxable income of $42,575 which is at the very middle of this particular interval. If your taxable income is in the lower half of this interval, you are paying a bit more than you should and if your taxable income is in the upper half of this interval, you are paying a little less. Over the years, it will balance out because you will pay too much some years and too little other years.