
A couple wants to buy a house whose price is $150,000. They can afford a down payment of $30,000 and will finance the rest with a 25-year mortgage at 7.69% compounded monthly. They want to know what their monthly payment will be, how much they will pay in interest, and what the APR will be.
1. Download and open the workbook LoansLab02.xlsx. Remind me how. On the "Mortgage" worksheet, enter your name in cell B1. Complete the mathematical model on that sheet including the amortization schedule.
2. Use the amortization schedule to determine which payment is the first one for which balance reduction is greater than the interest. Write down the payment number (i.e., period number). How many years does this represent?
3. What if the interest rate gets smaller? Do you think that the break-even point will occur sooner or later?
4. Change the interest rate 5.00% compounded monthly. For what payment does the balance reduction first exceed the interest? Was your answer to #3 above correct? When you are done, set the interest rate back to 7.69%.
5. Insert a line chart to illustrate how the balance due declines over time.
6. Insert a stacked area chart to illustrate how payments are divided between interest and balance reduction.
7. Use the Goal Seek tool to determine how much this couple can borrow if they can afford monthly payments of $775.
Some lenders offer a mortgage with a low interest rate for the first few years and then increase the rate for the remainder of the loan. A couple assumes a 30-year, $200,000 mortgage at an interest rate of 4% compounded monthly. After 5 years, the interest rate will go up to 7.5%. We want to answer the following questions. How much is their monthly payment the first 5 years? How much is their monthly payment the last 25 years? What is the total amount of interest that they pay?
1. Activate the "ARM" worksheet and put your name in cell B1.
2. In column B (the first 5 years), complete the model as you normally would for a 30-year mortgage. You should get a payment of $954.83.
3. Enter the formulas for the first two rows of the amortization schedule. Copy the second row of formulas down one row and make sure that all of the results look reasonable. When everything is correct, copy the formulas down through period 60 of the table. This takes us down through the first five years. The new balance at the end of 60 months should be $180,895.15. Correct your work until you get the right answer.
4. The present value of the "new", higher-rate mortgage for the last 25 years (cell C10) is the present value of the remaining payments for the original, lower-rate mortgage. This should be very nearly the same as the balance due on the original mortgage at the end of 60 months. (The table entry is exact but the present value calculation doesn't take rounding into account.)
5. In column C (the last 25 years), complete the model as you normally would for a 25-year mortgage. You should get a payment of $1,336.80 per month for the last 25 years of the mortgage. This is an increase of about $382 a month.
6. Copy the formulas for period 60 (cells B73:F73) down one row to period 61. You'll need to make two changes in the formulas for period 61. Change the formula in cell C75 (which represents the periodic interest) from B$7 to C$7 to reflect the change in the periodic interest rate. Change the formula in cell D75 (which represents the balance reduction) from B$4 to C$4 to reflect the change in the periodic payment. The periodic interest for period 61 should be $1,130.59 which is an increase of $526.44 from the previous month. Notice also that the amount going to reduce the balance fell $144.47 from $350.68 in month 60 to $206.21 in month 61.
7. Copy the formulas for period 61 down to period 62 and make sure everything looks right. Then copy the formulas down to the bottom of the table. You'll have to adjust the last balance reduction, as you have done before, so that the final balance due is exactly zero.
8. Highlight the values in the interest column and find the sum displayed at the bottom of the worksheet. You should find that the total interest paid for this mortgage is $258,329.13.
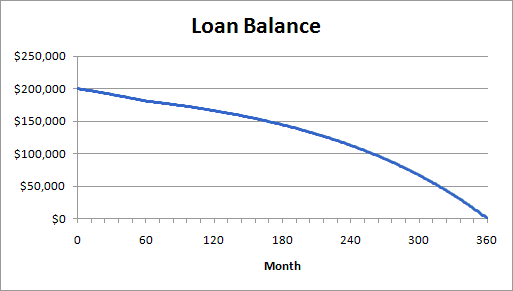
9. Create a line chart to illustrate how the balance due declines over time. Hint: after you have highlighted the new balance column, scroll up to the top of the worksheet before you insert the line chart. New charts are created on the visible portion of the worksheet so scrolling to the top ensures that the chart will be at the top of the worksheet rather than at the bottom. Your chart should look like this:

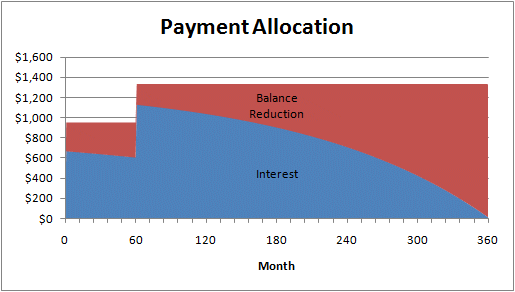
10. Create a stacked area chart to illustrate how the allocation of the payments changes over time. Your chart should look like this:

Notice that for month 61, the payment (overall height) and interest (height of blue portion) both increased sharply and the amount that goes to balance reduction (the height of the red area) decreased noticeably.
1. A woman invested $1200 a year for 40 years into a retirement account paying 6.3% compounded annually. How much does she have in her account at the end of the 40 years? How much interest did she earn? What is the annual percentage yield on this investment? You should find that the future value of this sinking fund is $200,319.37.
2. She now wishes to use this account to help finance her retirement years. How much can she withdraw at the end of each year assuming that the balance will remain the same? Notice that she is using only the interest that she earns to help finance her retirement. You should find that the annual interest on $200,319.37 is $12,620.12.
3. Suppose that the interest alone is not enough. How much can she withdraw from her account at the end of every year for 20 years assuming that her account will be emptied after the 20-year term? How much interest will she have earned during those twenty years? This situation is modeled as a loan where, conceptually, the bank has borrowed the money from the woman and is paying it back to her with 20 annual payments. Notice that in this situation she is using both her principal and her interest to help finance her retirement. You should find that her monthly income rises to $17,892.48.
4. Generate a table showing how her balance increased during her working years and decreased during her retirement years (assuming she uses both principal and interest to help finance her retirement for 20 years after retiring). The fourth column in the table serves a dual purpose. For the first 40 years, this column represents the monthly payment into her retirement account. This part of the table will be exactly like the regular savings tables we did earlier. Over the last 20 years, the fourth column represents the balance reduction; the amount of money taken out of her account (in addition to the interest she earned for the year). This part of the table will be like our loan amortization tables.
Create a line chart illustrating how her account balance grows and decreases over the total 60-year span of time.
Create a stacked area chart illustrating how her interest payments compare to her investments over the first 40 years and how her income over the last 20 years is divided between interest and balance reduction. You should notice that after the first 12 years, she is earning more in interest from the bank than she is investing into the account. By the 40th year, the amount she earns in interest greatly exceeds her own investment. During her retirement, the interest she earns accounts for the majority of her annual income for the first 9 years. For the last 11 years she must withdraw more and more from her account to meet her annual needs.
You can check your work by looking at my competed workbook: LoansLab02Answers.xlsx