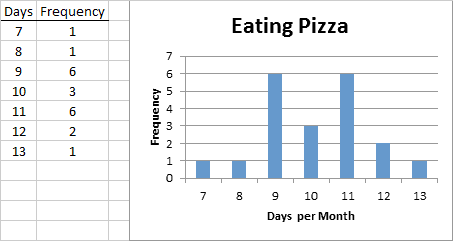
Students were surveyed to see how often they ate pizza in a month. The results are given here:
10, 12, 10, 11, 11, 9, 11, 12, 9, 11, 10, 8, 11, 9, 9, 9, 7, 13, 9, 11
Construct an ungrouped frequency distribution and illustrate your distribution with a column chart.